State School

Sulivan Primary School | Ofsted Ratings, Reviews, Exam Results & Admission 2027
Sulivan Primary School
Sulivan Primary School
- Primary
- Hammersmith and Fulham SW6 3BN
1 schools in compare list
Ofsted report
Notify us of new Ofsted report
Quick insights from ofsted Powered by AI
This insight was generated by AI, based on latest Ofsted report.
Foundational Skills: Pupils benefit from termly enrichment weeks, such as arts and community weeks.
Success of the Curriculum: Sulivan offers its pupils a broad curriculum, which staff continue to develop.
Foundational Skills: Phonics programme well-established, daily practice in reading.
Success of the Curriculum: Carefully sequenced curriculum reflecting national expectations.
Areas Needing Improvement: Leaders must ensure timescales for improvements reflect ambition and pace for strong progress.
Areas Needing Improvement: Published writing outcomes below expectations; plans to address identified.
Behaviour and Attitudes: This is reflected in their excellent behaviour and positive attitudes to learning.
Performance in Maths & Reading: Progress in reading and mathematics thoughtfully measured.
Behaviour and Attitudes: Pupils typically behave well and respect each other.
Performance in Maths & Reading: In 2018, the progress of key stage 2 pupils in writing was well below average, and in the bottom 10% nationally.
Support for Falling Behind: Leaders and teachers have worked alongside a speech and language therapist to devise a language curriculum for each year group.
Support for Falling Behind: Opportunities for practice; difficulties in other subjects not precisely identified.
Support for SEND Pupils: Staff feel valued and morale is high. Leaders report that this professional dialogue has significantly contributed to improving the quality of teaching and learning in the school.
Support for SEND Pupils: Wide range of support ensuring access to curriculum for SEND pupils.
Managing Bullying and Pupil Safety: Safeguarding is effective. There is no bullying at Sulivan.
Promotion of Welfare and Safety: Pupils trust that their teachers will take care of them. Adults know what to do if they have concerns about a pupil or colleague.
Managing Bullying and Pupil Safety: Confident to report concerns; issues addressed promptly and fairly.
Promotion of Welfare and Safety: Promotes good citizenship and mental health awareness.
Parent Feedback: Parents are overwhelmingly positive about the care their children receive.
Parental Involvement: Every effort is made to engage parents in their children’s education.
Parent Feedback: Parents value community ethos and dedicated staff.
Parental Involvement: Encouraged through workshops, assemblies, and reading sessions.
Extracurricular Activities: Pupils have the opportunity to attend a variety of extra-curricular clubs, which change termly.
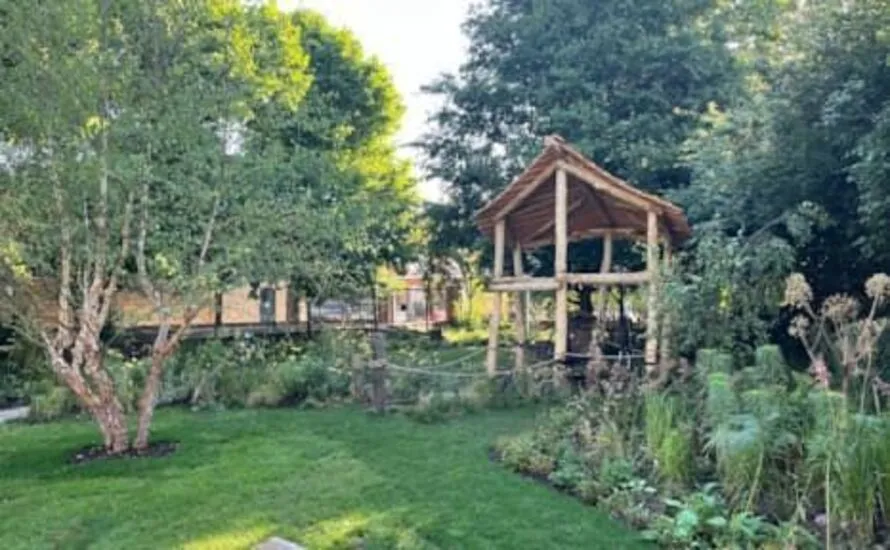
Outdoor Facilities: Particular care has gone into designing the school’s outdoor spaces. The outdoor space is a source of happiness for the children.
Extracurricular Activities: Junior orchestra and outdoor garden lessons offered.
Teacher Engagement: Staff feel valued and morale is high.
Impact on Student Progress: Staff greatly value opportunities to train, plan, and share good practice, contributing to improved teaching quality.
Teaching Staff Challenges: Teachers’ planning takes into account the need to ensure that most-able pupils are challenged in every lesson.
Teacher Engagement: Staff proud to work here, supported by trust’s professional networks.
Assessment of Teaching Quality: When reviewing and improving their writing, pupils do not always act on feedback from their teachers.
Impact on Student Progress: Phonics and reading progress well-supported; improvement needed in other subjects.
Historical Ofsted reports
Contact
About Us
Sulivan Primary School is a Primary, Co-Ed school located in Greater London, London.
It has 148 students from age 3-11 yr.
At this school, 49% of pupils achieved higher standard in reading, writing & maths at key stage 2.
This school rated Good by recent Ofsted inspection.
Distance calculator
Simply click on 'Detect My Location' to find out the distance from your current location to the school.
Sulivan Primary School
Nearby Schools in Your Area
From the Sulivan Primary School
Welcome to Sulivan Primary School, a vibrant, inclusive, and small-form-entry school for children aged 3–11, located in the heart of Parson’s Green, just moments from the beautiful Hurlingham Park in the London Borough of Hammersmith & Fulham.
As proud members of the United Learning Academy Trust, we uphold high expectations for learning.
Our dedicated teaching team delivers a broad and stimulating curriculum that fosters curiosity, creativity, and confidence across a wide range of subjects.
School tours are available throughout the term and offer a chance to meet our team, explore our facilities, and learn more about our values, vision and the wonderful opportunities we offer our pupils.
To book a tour, please complete the form on our website or contact the school office.
Gallery

Compare with similar schools
| Phase of Education | Primary | Primary | Primary |
|---|---|---|---|
| Type | Academies | Academies | Academies |
| ������ý grade |
A-
|
A
|
A+
|
| Ofset report | Good | Good | Outstanding |
| Age range | 3-11 | 3-11 | 3-11 |


| Gender | Co-Ed | Co-Ed | Co-Ed |
|---|---|---|---|
| Student teacher ratio | - | 17.4 | 22.1 |
| Proficient Math | 102 | 110 | 110 |
| Proficient Read | 106 | 105 | 109 |
| Grade 5 or above GCSE | - | - | - |
| Grade 5 or above A Level | - | - | - |
| Day Fees | - | - | - |
Primary Exam Result
View the average scaled scores of pupils in the key stage 2 reading and math tests. Scores of 100 or more indicate the expected standard, while 110 or more indicate a higher standard.
| Average scaled score | School | LA | England |
|---|---|---|---|
| Maths | 102 | 101 | 97 |
| Reading | 106 | 101 | 98 |
Explore how well our pupils are doing academically. Discover the percentage of pupils who reach the expected level (with a score of 100 or more) and those who excel even further (achieving a score of 110 or more).
| Reading, writing and maths | School | LA | England |
|---|---|---|---|
| Pupils meeting the expected standard | 49% | 68.84% | 55.96% |
| Pupils achieving at a higher standard | 11% | 15.03% | 7.42% |
Explore how much progress pupils have made in reading, writing, and math from key stage 1 to key stage 2.
| Subject | Progress score | Description |
|---|---|---|
| Reading | -0.6 | Below Average |
| Writing | -2 | Below Average |
| Maths | -1.3 | Below Average |
Exam Result Not Published
Due to the pandemic 2020, 2021 and 2022 Primary school exam
results were not published at school level.
Exam Result Not Published
Due to the pandemic 2020, 2021 and 2022 Primary school exam
results were not published at school level.
Exam Result Not Published
Due to the pandemic 2020, 2021 and 2022 Primary school exam
results were not published at school level.
View the average scaled scores of pupils in the key stage 2 reading and math tests. Scores of 100 or more indicate the expected standard, while 110 or more indicate a higher standard.
| Average scaled score | School | LA | England |
|---|---|---|---|
| Maths | 105 | 92 | 96 |
| Reading | 104 1 | 92 | 95 |
Explore how well our pupils are doing academically. Discover the percentage of pupils who reach the expected level (with a score of 100 or more) and those who excel even further (achieving a score of 110 or more).
| Reading, writing and maths | School | LA | England |
|---|---|---|---|
| Pupils meeting the expected standard | 76% | 68.22% | 60.44% |
| Pupils achieving at a higher standard | 4% | 12.62% | 9.72% |
Explore how much progress pupils have made in reading, writing, and math from key stage 1 to key stage 2.
| Subject | Progress score | Description |
|---|---|---|
| Reading | -1.0 | Below Average |
| Writing | -1.6 | Below Average |
| Maths | -0.6 | Below Average |
View the average scaled scores of pupils in the key stage 2 reading and math tests. Scores of 100 or more indicate the expected standard, while 110 or more indicate a higher standard.
| Average scaled score | School | LA | England |
|---|---|---|---|
| Maths | 105 | 95 | 94 |
| Reading | 105 | 95 | 95 |
Explore how well our pupils are doing academically. Discover the percentage of pupils who reach the expected level (with a score of 100 or more) and those who excel even further (achieving a score of 110 or more).
| Reading, writing and maths | School | LA | England |
|---|---|---|---|
| Pupils meeting the expected standard | 64% | 67.62% | 59.51% |
| Pupils achieving at a higher standard | 4% | 15.16% | 9.16% |
Explore how much progress pupils have made in reading, writing, and math from key stage 1 to key stage 2.
| Subject | Progress score | Description |
|---|---|---|
| Reading | -1.8 | Below Average |
| Writing | -6.4 | Well Below Average |
| Maths | -0.9 | Below Average |
Exam Result Not Published
Due to the pandemic 2020, 2021 and 2022 Primary school exam
results were not published at school level.
How Do We Calculate Rankings?
Our school rankings are meticulously determined through a rigorous process:
This meticulous process ensures our rankings provide accurate and meaningful insights for your school choices.
Admission
Fees
| Program | Age | Fee |
|---|---|---|
| Nursery Provision Full Time | 3-4 yr | £18 (Day) |
| Nursery Free entitlement 15 hours per week | 3-4 yr | £0 (Term) |
Holidays & terms
Holidays 2024/25
| Holidays | Date |
|---|---|
| Autumn Half Term Holidays | 28th Oct 2024 - 1st Nov 2024 |
| Winter Holidays | 23rd Dec 2024 - 3rd Jan 2025 |
| Spring Half Term Holidays | 17th Feb 2025 - 21st Feb 2025 |
| Spring Holidays | 7th Apr 2025 - 21st Apr 2025 |
| Summer Half Term Holidays | 26th May 2025 - 30th May 2025 |
| Summer Holidays | 23rd Jul 2025 - 29th Aug 2025 |
Terms Dates 2024/25
| Terms | Dates |
|---|---|
| Autumn Term | 1st Sep 2025 - 23rd Oct 2025 |
| Autumn Term-2 | 3rd Nov 2025 - 18th Dec 2025 |
| Spring Term | 6th Jan 2026 - 13th Feb 2026 |
| Spring Term-2 | 23rd Feb 2026 - 26th Mar 2026 |
| Summer Term | 14th Apr 2026 - 22nd May 2026 |
| Summer Term-2 | 1st Jun 2026 - 17th Jul 2026 |
Students Teachers